XHProf is a great server-side performance profiler. And as we say in our Drupal community… "there is a module for that". Great as it is, the Drupal XHProf module comes with little documentation. So finding out how and where to install some of the unmentioned bits and pieces can be a chore. Especially when you find yourself faced with downloading and compiling various components on a machine that doesn’t have the full gamut of tools like pecl, apt-get or Homebrew, etc ready to go.
So this is what I normally do for Macs, greatly facilitated by Cameron Tod's very handy page.
o Let’s start on familiar Drupal grounds. Install the XHProf module. The module allows you to easily flick profiling on and off, without the need for defining an additional virtual host and accompanying special domain. The module also comes with some nice touches like selecting the verbosity of the XHProf output and not running XHProf on admin pages.
o The page ..../admin/reports/status/php on your Drupal site will tell you which PHP configuration file (php.ini file) your site has loaded. Edit that php.ini, adding these lines:
extension = xhprof.so

xhprof.output_dir = ...
On a Mac, typical candidates for filling out the above dots are /Users/USERNAME/Sites/xhprof/runs or /tmp/xhprof. Whatever you choose, make sure to create that directory or the xhprof module will spit the dummy. Keep in mind that the /tmp directory is automatically cleared upon startup, so you’ll have to create /tmp/xhprof again after a reboot.
o On https://github.com/cam8001/php-xhprof-mamp select the pre-compiled version of xhprof.so that corresponds to the PHP version you found above. Drop the xhprof.so in /Applications/MAMP/bin/php/php5.x.x/lib/php/extensions/no-debug-non-zts-200xxxxx/, replacing the x'es with your PHP version and date. If you've done this correctly then after restarting MAMP and refreshing the page .../admin/reports/status/php will display a xhprof section.
o In a Terminal window type these commands:
cd ~/Sites

curl http://pecl.php.net/get/xhprof > xhprof.tgz

tar -xzf xhprof.tgz

mv xhprof-* xhprof

mkdir xhprof/runs

# or: mkdir /tmp/xhprof
o Visit .../admin/config/development/xhprof and tick the “Enable” box. Accept the remaining defaults for now. You can revisit these later.
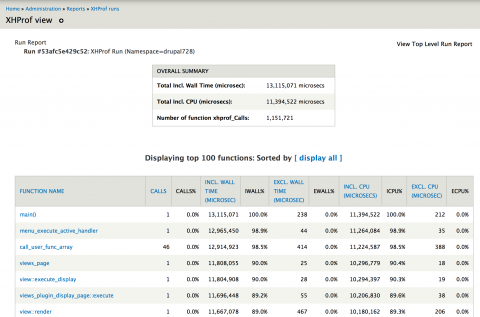
o Visit the homepage, or any other page of your site. Scroll UP to see a link “XHProf output” at the very bottom of your browser window. Click that link and a list of the top 100 suspects should come up.
Happy profiling!
In a follow-up article we'll demonstrate how XHProf can help you discover where exactly server-side performance is lost on your site and the nifty Drupal accelerator module that came out of that.
TIP: when done with your profiling, don't forgot to untick the "Enable" box on the XHProf module config page -- leaving XHProf on easily adds 40% to your execution times.
Comments
Does the XHProf module have
Does the XHProf module have any advantages over using devel xhprof?
Good question!